The Transformative Power of Artificial Intelligence: Shaping the Future In the realm of technological advancements, few innovations have captured the world's imagination as much as Artificial Intelligence (AI). From science fiction to reality, AI has become a powerful force driving transformative changes across various industries and sectors. Its significance cannot be overstated, as it has the potential to reshape the way we live, work, and interact with our surroundings. In this blog, we delve into the importance of AI and explore the profound impact it has on our society. 1. Enhancing Efficiency and Productivity: One of the most apparent benefits of AI is its ability to boost efficiency and productivity across industries. By automating repetitive tasks, AI liberates human resources to focus on more complex and creative endeavors. Businesses can streamline processes, optimize resource allocation, and make data-driven decisions faster, resulting in cost savings and increased com...
This article is intended for beginners in deep learning who wish to gain knowledge about probability and statistics and also as a reference for practitioners.
In my previous article, I wrote about the concepts of linear algebra for deep learning in a top down approach ( link for the article ) (If you do not have enough idea about linear algebra, please read that first).The same top down approach is used here.Providing the description of use cases first and then the concepts.
All the example code uses python and numpy.Formulas are provided as images for reuse.
Table of contents:
- Introduction
- Foundations of probability
- Measures of central tendency and variability
- Discrete probability distributions, binomial distribution
- Continuous probability distributions, uniform and normal distributions
- Model Accuracy measurement tools
- Random process and Markov chains
- Probabilistic programming
- External resources
Introduction:
Probability is the science of quantifying uncertain things.Most of machine learning and deep learning systems utilize a lot of data to learn about patterns in the data.Whenever data is utilized in a system rather than sole logic, uncertainty grows up and whenever uncertainty grows up, probability becomes relevant.
By introducing probability to a deep learning system, we introduce common sense to the system.Otherwise the system would be very brittle and will not be useful.In deep learning, several models like bayesian models, probabilistic graphical models, hidden markov models are used.They depend entirely on probability concepts.
Real world data is chaotic.Since deep learning systems utilize real world data, they require a tool to handle the chaoticness.
It is always practical to use a simple and uncertain system rather than a complex but certain and brittle one.
The versions of probability and statistics presented here are a highly simplified versions of the actual subjects. Both are very huge and individual research subjects. But the concepts written here is enough for a deep learning aspirant. I have left links for some great resources on these individual subjects in the end of this article.
Foundations of probability:
If you start deep learning, the very first example(probably), the tutor provides you is the MNIST handwritten digit recognition task.It is like the hello world of deep learning.


The task is to classify handwritten digits and label them. As I mentioned earlier, the machine learning system which you create to do this task is not accurate or certain.The images are 28*28 pixel images.For example, consider the below neural network for this task.

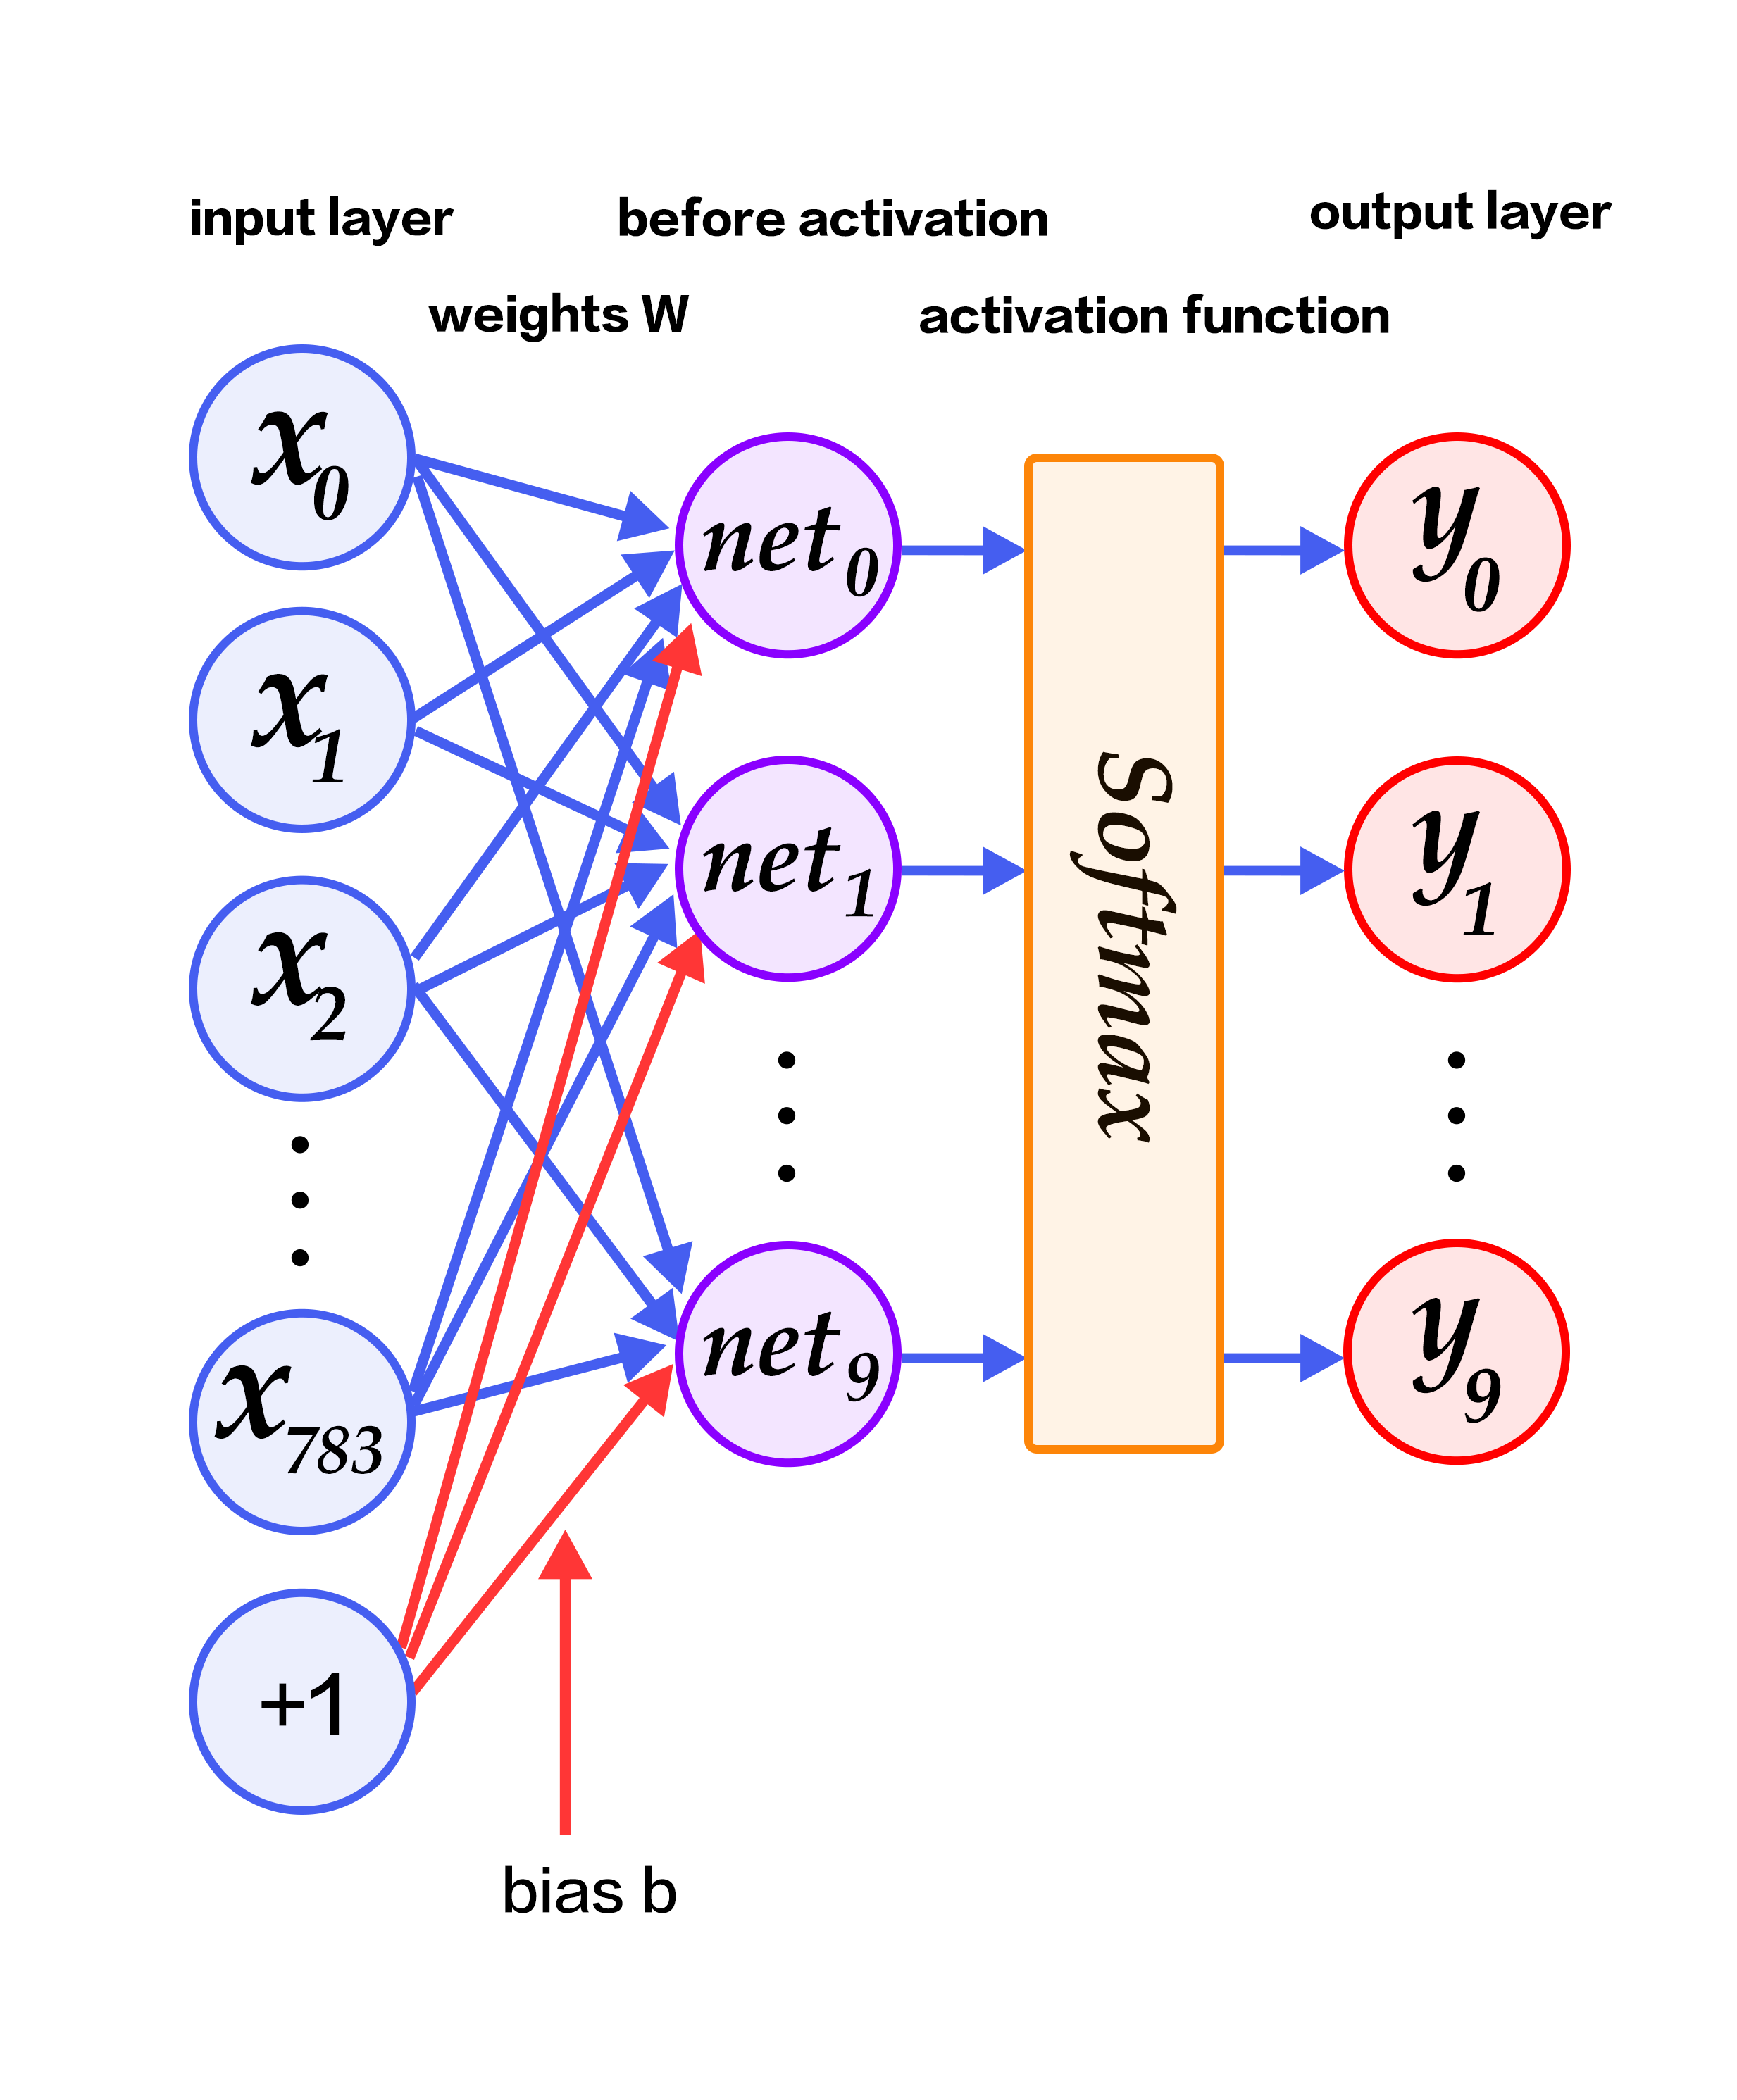
The input layer is a flattened vector of the size of the input image(28*28=784).It is passed to a layer, where the input vector is multiplied by the weights and added with the bias vector. This layer has 10 neurons. This is the implication that there are 10 digits.Then they go through a softmax activation function.
After this step they do not output the exact digit but a vector of length 10 with each element being a probability value for each digit.
We use argmax to get the index of the probability with the highest value in the output vector.(which is the prediction)
Having said this, we shall revisit softmax in detail.The point here is that to understand this neural network, we have to understand some basics of probability.
vector y = [y0, y1, y2, y3, y4, y5, y6, y7, y8 , y9]
Where is probability in this?
Sample space: The set of all possible values in an experiment.(In the above example, the input can be from a set of images,thus it is the sample space for the input,similarly, the output prediction can take any value from the digits 0 to 9, thus the digits are the sample space for the output prediction.)
Random variable: A variable that can take different values of the sample space randomly. In the above neural network, the input vector x is a random variable, the output ‘prediction’ is a random variable, the weights of the neural network is also a random variable(because they are initialized randomly using a probability distribution.)
Probability distribution: The probability distribution is a description of how likely the random variable is to take on different values of the sample space.In the neural network, the weights are initialized from a probability distribution.The output vector y follows softmax distribution which is also a probability distribution that shows the probability of X taking different digit values.(In general,softmax provides the probability of categorical values)
In this example, the probability distribution y is discrete(having 10 discrete values.) whereas in some other cases, it may be continuous(the sample space is also continuous).In a discrete distribution, the probability distribution is provided by a probability mass function(pmf) denoted by P(x=x). In the above example, the softmax function is the pmf of the random variable X.
If you see some instance of the output vector y = [0.03,0.5,0.07,0.04,0.06,0.05,0.05,0.06,0.04,0.1]
What’s so special in this? If you look closely they all add up to 1.0 and the argmax shows that index 1 has maximum value of 0.5 indicating the value should be 1.
This property of adding upto 1.0 is called normalization.Also the values must be between 0 and 1. An impossible event is denoted by 0 and a sure event is denoted by 1.
The same conditions hold true for continuous variables.(We’ll see in a moment.)
3 basic definitions:
In any probability book or class, you will always learn these 3 basics in the very beginning.They are conditional probability, marginal probability and joint probability.
Joint Probability:What is the probability of two events occurring simultaneously .denoted by P(y=y,x=x) or p(y and x). Example: probability of seeing sun and moon at the same time is very low.
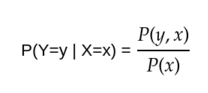
Conditional probability: What is the probability of some event y happening, given that other event x had happened .denoted by P(y = y | x =x). since the other event x had occurred, it’s probability can’t be zero. Example: probability of drinking water after eating is very high.

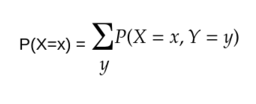
Marginal probability:what is the probability of a subset of random variables from a superset of them.Example: probability of people having long hair is the sum of probability of men having long hair and probability of women having long hair.(Here the long hair random variable is kept constant and the gender random variable was changed.)

Bayes’ theorem: It describes the probability of an event based on prior knowledge of other events related to that event.

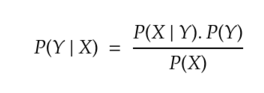
Bayes theorem exploits the concept of belief in probability. “I am 40% sure that this event will happen” is not the same as “The dice has 16% chance of showing 6”.The former utilizes belief and is called as bayesian probability while the latter depends on previous data and is called as frequentist probability. Read more
Bayes theorem is also used in one of the most simple machine learning algorithm called the naive bayes algorithm.see sklearn docs.
Measures of central tendency and variation:
Mean: Mean is the arithmetical average value of the data. numpy docs


import numpy as np
a = np.array([[1,2,3,4,5,6]])
np.mean(a,axis=0)Median: It is the middle value of the data. numpy docs.
np.median(a,axis=0)Mode: It is the frequently occuring value of the data. scipy docs.
import numpy as np
from scipy import statsstats.mode(a)
Expected value: of some variable X with respect to some distribution P(X=x) is the mean value of X when x is drawn from P.

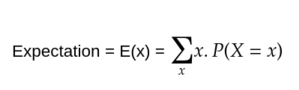
The expectation is equal to the statistical mean of the dataset. look why.
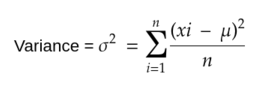
Variance: It is the measure of variability in the data from the mean value.

import numpy as np
a = np.array([[1,2,3,4,5,6]])np.var(a)
For a random variable, variance is given by,

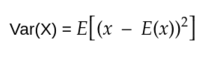
this formula has the same meaning as the above formula. numpy docs.
Standard deviation:It is the square root of variance. numpy docs.


import numpy as np
np.std(a)
The are also some other measures of variation like range and interquartile distance.look here
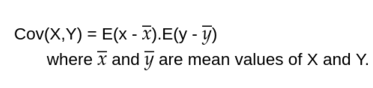
Co variance: It shows how to two variables are linearly related to each other. Numpy outputs a covariance matrix where Cij denotes the covariance between xi and xj. numpy docs

np.cov(a)Probability distributions:
As I mentioned in the beginning,several components of the neural networks are random variables.The values of the random variables are drawn from a probability distribution.In many cases,we use only certain types of probability distributions.Some of them are,
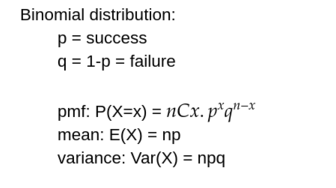
Binomial distribution: A binomial random variable is the number of successes in n trials of a random experiment. A random variable x is said to follow binomial distribution when, the random variable can have only two outcomes(success and failure).Naturally , binomial distribution is for discrete random variables. numpy docs.

import numpy as npn=10 # number of trialsp=0.5 # probability of success
s=1000 # size
np.random.binomial(n,p,s)
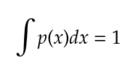
Continuous distributions: These are defined for continuous random variables.In continuous distribution, we describe the distribution using probability density functions(pdf) denoted by p(x).
Their integral is equal to 1.

If you are not comfortable with integral or differential calculus look here,
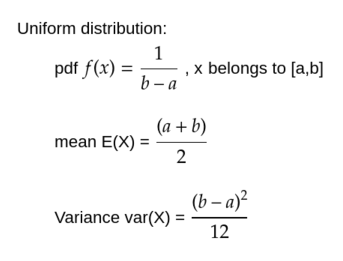
Uniform Distribution: It is the simplest form of continuous distribution, with every element of the sample space being equally likely. numpy docs

import numpy as np
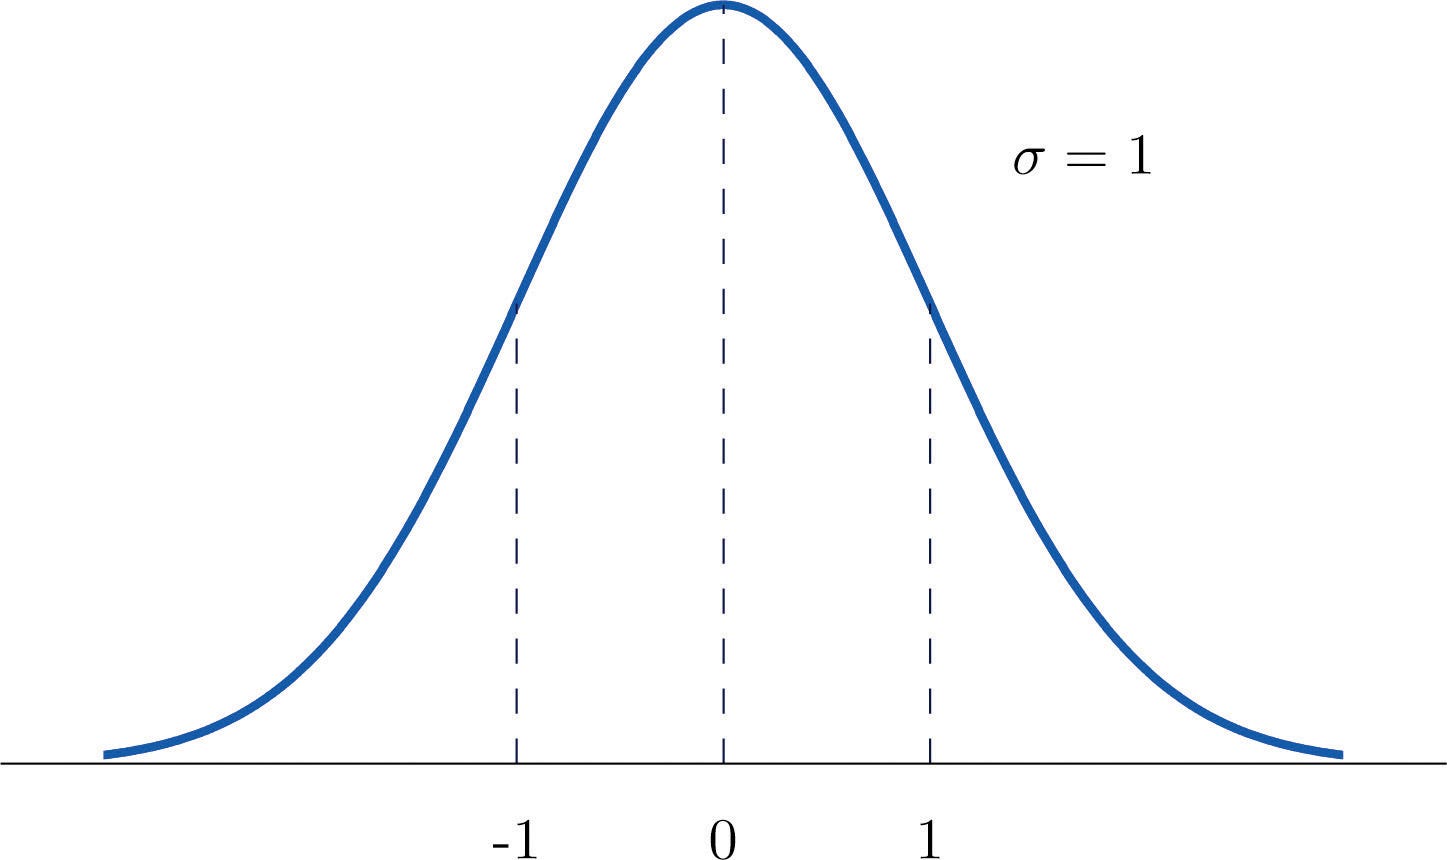
np.random.uniform(low=1, high=10,size=100)Normal distribution: “Order from Chaos”
It is the most important of all distributions.Also known as Gaussian distribution.In the absence of prior knowledge about what form a distribution over the real numbers should take, the normal distribution is a good choice because, it has high entropy and central limit theorem suggests that sum of several independent random variables is normally distributed. numpy docs


import numpy as np
mu = 0
sigma = 1
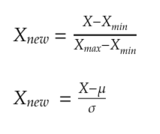
np.random.normal(mu,sigma,size=100)In a normal distribution, if the mean is 0 and the standard deviation is 1, then it is called as standard normal distribution.

In machine learning, you often encounter the word ‘ normalization’ and ‘standardization’. the process which we did above to obtain standard normal distribution is called standardization whereas the process of restricting the range of dataset values between 0.0 to 1.0 is called as normalization. However, these terms are often interchanged.

from sklearn.preprocessing import StandardScaler
import numpy as npdata = np.array([1,2,3,4,5])
scaler = StandardScaler()
scaler.fit_transform(data)
At this stage, we have come across several formulae and definitions. It is very useful if you memorize all these.(Or use this article as a reference! )There are also other important distributions like exponential and poisson distribution. refer here for a quick glance.
Softmax distribution:In the beginning of this article, I mentioned about softmax. It is a probability distribution kinda.It is best used to represent 1 of N class categorical distribution. It is also the most commonly used distributions in deep learning.It is very convenient to differentiate.


def softmax(x):
    e_x = np.exp(x - np.max(x))
    return e_x / e_x.sum(axis=0)##the np.max(x) is used just for numerical stability.it is Not ##formula
Model accuracy measurement tools:
In order to measure the performance of a deep learning model, we use several concepts. Knowing these concepts is very important.They are called as metrics.In the above MNIST neural network, if the neural network predicted 95 of the 100 input images correctly, then it’s accuracy is said to be 95% and so on.(This part uses sklearn python library for examples.)
You can understand accuracy intuitively, but the theory is,It is the proposition of correct results in the total obtained results.
Accuracy is a very simple measurement and it may provide wrong insights sometimes.In some cases, higher accuracy doesn’t mean our model is working correctly.To clarify this, first look at the following definitions,
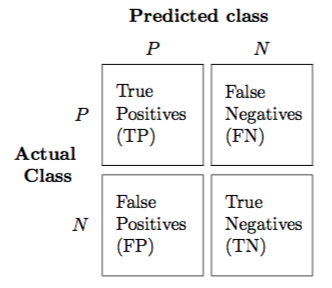
- True Positives (TP): number of positive examples, labeled as such.
- False Positives (FP): number of negative examples, labeled as positive.
- True Negatives (TN): number of negative examples, labeled as such.
- False Negatives (FN): number of positive examples, labeled as negative.
Accuracy = (TP + TN)/(TP + FP + TN + FN)Confusion matrix: It is a matrix containing the TP, FP,TN and FN values.

from sklearn.metrics import confusion_matrix
y_true = [2, 0, 2, 2, 0, 1]
y_pred = [0, 0, 2, 2, 0, 2]
confusion_matrix(y_true, y_pred)
Now, Imagine a binary classifier, that outputs 1 or 0. If everything was proper and the model was not biased, it says the actual accuracy.But if we tweak the model to say 0 all the time(or 1 all the time)(now the prediction power of the model is None).but still we would get a high accuracy! consider the table.
                 Classified positive  Classified negative
Positive class         0 (TP)            25 (FN)
Negative class         0 (FP)           125 (TN)
This table is obvious that the model is very bad(because all the positive class examples are incorrectly classified) but the accuracy is 83% !!
Precision and recall: So we go for two other metrics-precision and recall.


Precision tells you how many of the selected objects were correct
Recall tells you how many correct objects were selected.
In the above example, both precision and recall are 0.0 This indicates that the model is extremely poor.
F1 score: It is the harmonic average of precision and recall.


F1 score of 0 means worst and 1 means best.By using this, we can resolve the chaotic behaviour of accuracy metric.
Sklearn has a classification_report function that you can invoke to get the precision, recall, f1 score.
>>> from sklearn.metrics import classification_report
>>> y_true = [0, 1, 2, 2, 2]
>>> y_pred = [0, 0, 2, 2, 1]
>>> target_names = ['class 0', 'class 1', 'class 2']
>>> print(classification_report(y_true, y_pred, target_names=target_names))
              precision    recall  f1-score   support

     class 0       0.50      1.00      0.67         1
     class 1       0.00      0.00      0.00         1
     class 2       1.00      0.67      0.80         3

   micro avg       0.60      0.60      0.60         5
   macro avg       0.50      0.56      0.49         5
weighted avg       0.70      0.60      0.61         5
Mean Absolute error: It is the average of difference between the original and predicted values.
Mean squared error: it is the average of square of difference between the original and predicted values.


from sklearn.metrics import mean_squared_error
y_true = [3, -0.5, 2, 7]
y_pred = [2.5, 0.0, 2, 8]
mean_squared_error(y_true, y_pred)
Mean squared error is widely used because it is easier to compute the gradients.
Receiver operating characteristic(ROC) curve:The roc curve is a graph showing the performance of classification models like our digit recognizer example.It has two parameters — True Positive rate(TPR) and False Positive rate(FPR).TPR is the same as recall and is also called as sensitivity. FPR is also 1-specificity.


These two are plotted against each other to obtain the following graph(several values of plots are obtained by changing the classification threshold and predicting the results again repeatedly.).The area under this ROC curve is a measure of the accuracy.

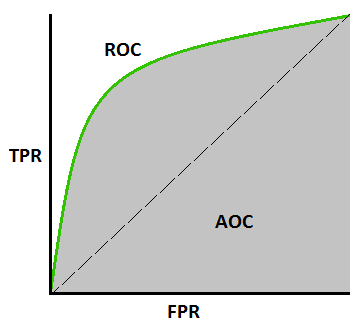
Interpretation of area under the curve(AUC):When AUC=1.0 the model is best.When AUC=0.5 the model is worst.But if AUC=0.0 then the model is reciprocating the results.(Like classifying 1's as 0’s and 0’s as 1's).
import numpy as np
from sklearn.metrics import roc_auc_score
y_true = np.array([0, 0, 1, 1])
y_scores = np.array([0.1, 0.4, 0.35, 0.8])
roc_auc_score(y_true, y_scores)
More information:look here and here.
Calculation of AUC using trapezoidal rule(sklearn uses this rule):look here
Random process, markov chains and graphical models:
A random process is a collection of random variables that are indexed by some values.Intuitively, a random process or stochastic process is a mathematical model for a phenomenon that proceeds in an unpredictable manner to the observer.The outcome of the next event is not dependent on the outcome of the current event.Example, a series of coin tosses.
If the index set by which the random variables are indexed in a random process are from a discrete natural numbers, then the process is called as discrete time random process or random sequence.If the index set lies in real number line, then the process is continuous time random process.If the index set lies in cartesian plane or some higher dimensional euclidean planes, then the process is said to be random field.
Random processes are a really interesting part of probability.They are used to model time related stuffs like weather forecast, stock market, natural phenomenons,etc.There are several random processes.Here we focus on markov chains.For a more elaborate material, refer wikipedia.
Markov chains:
A markov chain is a probabilistic automaton.It has states.It describes a sequence of events in which probability of transitioning from one state to another depends only on previous event. Here is an excellent visual explanation of markov chains.


This is a markov chain that describes the weather condition.The values represent the probability of transition from one state to another.
Markov chains are used for simple systems like next word prediction, language generation, sound generation and many other systems.
The extension of markov chains known as hidden markov models are used in speech recognition systems.
I have stopped random processes till here and planned for an extensive article on them because of the excessive length of the concept.
Probabilistic programming:
A new paradigm of programming has evolved known as probabilistic programming.These languages or libraries help to model bayesian style machine learning.It is an exciting research field which is supported by both the AI community and the software engineering community.These languages readily support probabilistic functions and models like gaussian models,markov models, etc.
One such library for writing probabilistic programs was created by Uber last year known as pyro which supports python with pytorch(a deep learning library) as the backend.


If you liked this article about probability and statistics for deep learning, leave claps for the article. The content provided here are intended for beginners in deep learning and can also be used as reference material by deep learning practitioners. But for beginners, I would also suggest several other awesome external resources, to reinforce their knowledge in the interesting field of probability.(Though the knowledge that you gained through this article is enough for proceeding in deep learning)
External Resources:
Awesome free course on deep learning and machine learning: fast.ai
Intuitive explanation of calculus: 3blue1brown
Best book on deep learning: the deep learning book
Random process: Sheldon M. Ross
Statistics: All of statistics by Larry Wasserman
Probability theory: William Feller
Thank you for sharing wonderful information
ReplyDeleteServiceNow Training
ServiceNow Online Training